How To Monitor Remote Linux Systems With Nagios Monitoring Tool
In the last article, we discussed the installation of Nagios server on CentOS 8, CentOS 7, Ubuntu 18.04 / 16.04, and Debian10 / 9. Here, in this post, we will add Linux host to the Nagios monitoring tool using the NRPE plugin.
I’m assuming that you have a working Nagios setup, if not, use any one of the below links and setup the Nagios server.
Install Nagios Server
READ: How to Install Nagios on CentOS 8 / RHEL 8
READ: How To Install Nagios on CentOS 7 / RHEL 7
READ: How To Install Nagios on Ubuntu 18.04 & Ubuntu 16.04
READ: How To Install Nagios on Debian 10 / 9
Monitor Remote Linux Systems With Nagios
On Remote Linux System
Nagios Remote Plugin Executor (abbreviated as NRPE) plugin allows you to monitor applications and services running on remote Linux / Windows hosts. This NRPE Add-on helps Nagios to monitor local resources like CPU, Memory, Disk, Swap, etc. of the remote host.
Install NRPE Add-on & Nagios Plugins
CentOS / RHEL
NRPE Server and Nagios plugins are available in the EPEL repository for CentOS / RHEL. So, configure the EPEL repository your CentOS / RHEL system.
### CentOS 8 / RHEL 8 ###

rpm -ivh https://dl.fedoraproject.org/pub/epel/epel-release-latest-8.noarch.rpm

### CentOS 7 / RHEL 7 ###

rpm -ivh https://dl.fedoraproject.org/pub/epel/epel-release-latest-7.noarch.rpm

### CentOS 6 / RHEL 6 ###

rpm -ivh https://dl.fedoraproject.org/pub/epel/epel-release-latest-6.noarch.rpm
Use the following command to install NRPE Add-on and Nagios plugins.
yum install -y nrpe nagios-plugins-all
Ubuntu / Debian
Use the following command to install NRPE Add-on and Nagios plugins.
sudo apt update

sudo apt install -y nagios-nrpe-server nagios-plugins
Configure NRPE Add-on
Modify the NRPE configuration file to accept the connection from the Nagios server, Edit the /etc/nagios/nrpe.cfg file.
### CentOS / RHEL ###

vi /etc/nagios/nrpe.cfg

### Ubuntu / Debian ###

sudo nano /etc/nagios/nrpe.cfg
Add the Nagios servers IP address, separated by comma like below.
allowed_hosts=192.168.0.10
Configure Nagios Checks
The /etc/nagios/nrpe.cfg file contains the basic commands to check the attributes (CPU, Memory, Disk, etc.architecure) and services (HTTP, FTP, etc.) on remote hosts.
CentOS / RHEL
vi /etc/nagios/nrpe.cfg
Below command lines let you monitor logged in users, system load, root filesystem usage, swap usage and the total number of the process with the help of Nagios plugins.
# COMMAND DEFINITIONS

...
...

command[check_users]=/usr/lib64/nagios/plugins/check_users -w 5 -c 10
command[check_load]=/usr/lib64/nagios/plugins/check_load -w 15,10,5 -c 30,25,20
command[check_root]=/usr/lib64/nagios/plugins/check_disk -w 20% -c 10% -p /
command[check_swap]=/usr/lib64/nagios/plugins/check_swap -w 20% -c 10%
command[check_total_procs]=/usr/lib64/nagios/plugins/check_procs -w 150 -c 200
Ubuntu / Debian
sudo nano /etc/nagios/nrpe.cfg
Below command lines let you monitor logged in users, system load, root filesystem usage, swap usage and the total number of the process with the help of Nagios plugins.
# COMMAND DEFINITIONS

...
...

command[check_users]=/usr/lib/nagios/plugins/check_users -w 5 -c 10
command[check_load]=/usr/lib/nagios/plugins/check_load -w 15,10,5 -c 30,25,20
command[check_root]=/usr/lib/nagios/plugins/check_disk -w 20% -c 10% -p /
command[check_swap]=/usr/lib/nagios/plugins/check_swap -w 20% -c 10%
command[check_total_procs]=/usr/lib/nagios/plugins/check_procs -w 150 -c 200
Test Nagios Checks
For example, execute the below command in another terminal to see the check result.
Ubuntu 18.04:
/usr/lib/nagios/plugins/check_procs -w 150 -c 200
Output:
PROCS WARNING: 190 processes | procs=190;150;200;0;
Nagios plugin will count running processes and will warn you if the process count is more than 150, or it will report you critical if the process count is more than 200, and at the same time, the output will state OK if the count is below 150.
You can adjust the alert level as per your requirements.
Change warning to 200 and critical to 250 for testing purposes. Now you will see an OK message.
/usr/lib/nagios/plugins/check_procs -w 200 -c 250
Output:
PROCS OK: 189 processes | procs=189;200;250;0;
These command definitions have to be entered on a template file on the Nagios server host to enable the monitoring.
Restart the NRPE service.
### CentOS / RHEL ###

systemctl start nrpe

systemctl enable nrpe

### Ubuntu / Debian ###

sudo systemctl restart nagios-nrpe-server
Firewall
Configure the firewall so that the Nagios server can able to reach the NRPE server running on a remote Linux host. Run these commands on a remote Linux machine.
FirewallD
firewall-cmd --permanent --add-port=5666/tcp

firewall-cmd --reload
IP Tables
iptables -I INPUT -p tcp --dport 5666 -m conntrack --ctstate NEW,ESTABLISHED -j ACCEPT

iptables -I OUTPUT -p tcp --sport 5666 -m conntrack --ctstate ESTABLISHED -j ACCEPT

/etc/init.d/iptables save
On Nagios Server
Install NRPE plugin
This NRPE plugin provides check_nrpe plugin which contacts the NRPE server on remote machines to check the services or resource.
CentOS / RHEL
Nagios NRPE plugin is available in the EPEL repository for CentOS / RHEL. So, configure the EPEL repository your CentOS / RHEL system.
### CentOS 8 / RHEL 8 ###

rpm -ivh https://dl.fedoraproject.org/pub/epel/epel-release-latest-8.noarch.rpm

### CentOS 7 / RHEL 7 ###

rpm -ivh https://dl.fedoraproject.org/pub/epel/epel-release-latest-7.noarch.rpm

### CentOS 6 / RHEL 6 ###

rpm -ivh https://dl.fedoraproject.org/pub/epel/epel-release-latest-6.noarch.rpm
Use the following command to install the NRPE plugin on your machine.
yum -y install nagios-plugins-nrpe
Ubuntu / Debian
Use the following command to install the NRPE plugin on your machine.
sudo apt install -y nagios-nrpe-plugin
Edit Configuration
Edit the Nagios configuration file to include all .cfg files inside the /usr/local/nagios/etc/servers directory.
### CentOS / RHEL ###

vi /usr/local/nagios/etc/nagios.cfg

### Ubuntu / Debian ###

sudo nano /usr/local/nagios/etc/nagios.cfg
Add or uncomment the following line.
cfg_dir=/usr/local/nagios/etc/servers
Create a configuration directory.
### CentOS / RHEL ###

mkdir /usr/local/nagios/etc/servers

### Ubuntu / Debian ###

sudo mkdir /usr/local/nagios/etc/servers
Add Command Definition
Now it’s time to configure the Nagios server to monitor the remote client machine, and You’ll need to create a command definition in Nagios object configuration file to use the check_nrpe plugin.
Open the commands.cfg file.
CentOS / RHEL
vi /usr/local/nagios/etc/objects/commands.cfg
Add the following Nagios command definition to the file.
# .check_nrpe. command definition
define command{
command_name check_nrpe
command_line /usr/lib64/nagios/plugins/check_nrpe -H $HOSTADDRESS$ -t 30 -c $ARG1$
}
Ubuntu / Debian
sudo nano /usr/local/nagios/etc/objects/commands.cfg
Add the following Nagios command definition to the file.
# .check_nrpe. command definition
define command{
command_name check_nrpe
command_line /usr/lib/nagios/plugins/check_nrpe -H $HOSTADDRESS$ -t 30 -c $ARG1$
}
Add a Linux host to Nagios server
Create a client configuration file /usr/local/nagios/etc/servers/client.itzgeek.local.cfg to define the host and service definitions of remote Linux host.
### CentOS / RHEL ###

vi /usr/local/nagios/etc/servers/client.itzgeek.local.cfg

### Ubuntu / Debian ###

sudo nano /usr/local/nagios/etc/servers/client.itzgeek.local.cfg
Copy the below content to the above file.
You can also use the following template and modify it according to your requirements. The following template is for monitoring logged in users, system load, disk usage (/ – partition), swap, and total process.
define host{

            use                     linux-server
            host_name               client.itzgeek.local
            alias                   client.itzgeek.local
            address                 192.168.0.20

}

define hostgroup{

            hostgroup_name          linux-server
            alias                   Linux Servers
            members                 client.itzgeek.local
}

define service{

            use                     local-service
            host_name               client.itzgeek.local
            service_description     SWAP Uasge
            check_command           check_nrpe!check_swap

}

define service{

            use                     local-service
            host_name               client.itzgeek.local
            service_description     Root / Partition
            check_command           check_nrpe!check_root

}

define service{

            use                     local-service
            host_name               client.itzgeek.local
            service_description     Current Users
            check_command           check_nrpe!check_users

}

define service{

            use                     local-service
            host_name               client.itzgeek.local
            service_description     Total Processes
            check_command           check_nrpe!check_total_procs

}

define service{

            use                     local-service
            host_name               client.itzgeek.local
            service_description     Current Load
            check_command           check_nrpe!check_load

}
Verify Nagios for any errors.
### CentOS / RHEL ###

/usr/local/nagios/bin/nagios -v /usr/local/nagios/etc/nagios.cfg

### Ubuntu / Debian ###

/usr/local/nagios/bin/nagios -v /usr/local/nagios/etc/nagios.cfg
Restart the Nagios server.
### CentOS / RHEL ###

systemctl restart nagios

### Ubuntu / Debian ###

sudo systemctl restart nagios
Check Nagios Monitoring
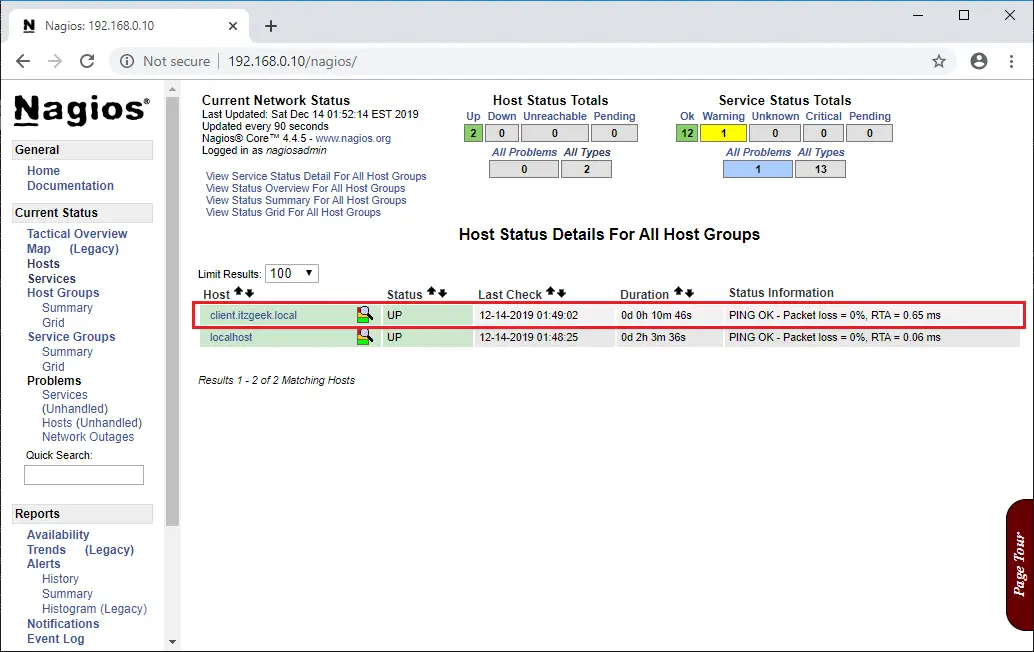
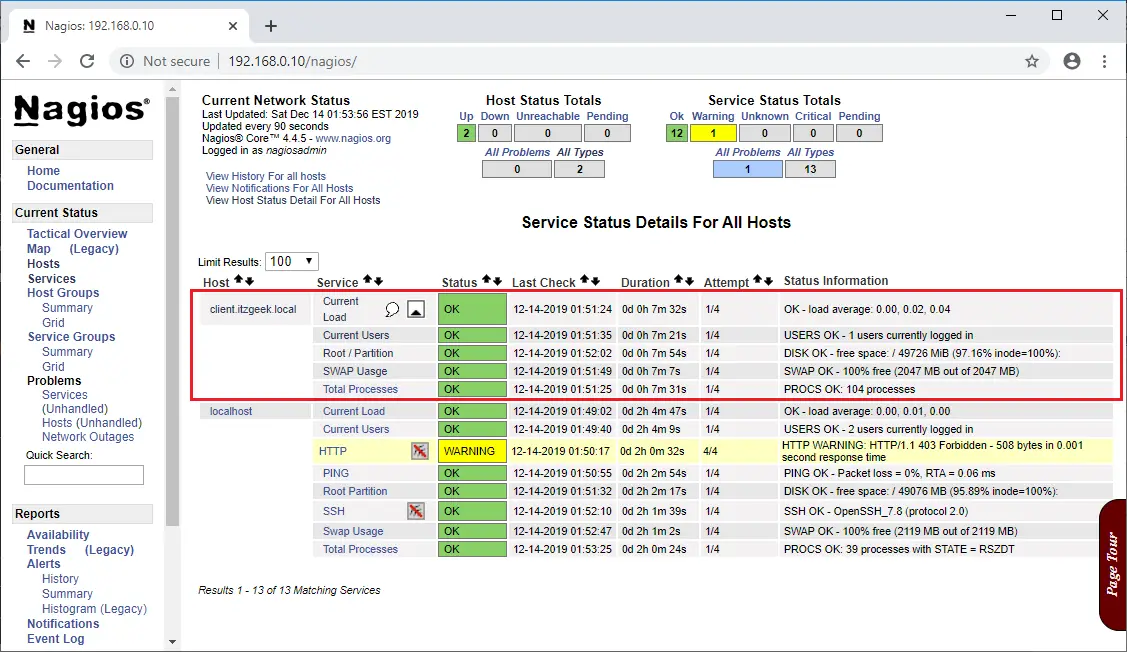
Go and check the Nagios web interface to view the new services we added just now.

Within a minute, you should start seeing the status on the services page.

Conclusion
That’s All. Please share your feedbacks in the comments section.
